JMP
SAS hat den Vertrieb von StatView Ende 2002 eingestellt und empfiehlt stattdessen JMP:
JMP bietet Forschern, Entwicklern und Managern verbesserte Statistik und statistische Interpretation. Als weltweit akzeptierter Standard für Analyse, vereinfacht JMP Statisken für Anfänger und enthält die umfangreichen analytischen Möglichkeiten, die von Experten benötigt werden. Es bietet die mächtige JMP Scripting Sprache (JSL), einen Menü Generator und Journaling Werkzeuge, die analytische Abläufe speichern und sie für eine ganze Organistation zur Verfügung stellen.
|
JMP für Firmen und Academic für Forschung und Lehre können Sie im Online-Shop bestellen (für Mac, Windows und Linux) |
 |
Benutzen Sie JMP um Probleme zu analysieren und Fragen zu beantworten |
|
|
Menüs, Pulldown Menüs und statistische Beratung sind in die Benutzerschnittstelle eingebaut |
|
|
Interaktive Graphen und Berichte werden während jeder Analyse erstellt und im gleichen Fenster wie die Daten dargestellt |
|
|
Klicken sie auf ein beliebiges Gebiet eines Graphen um die relevanten Daten in der Tabelle zu sehen und umgekehrt |
|
|
Hot-spot Symbole zeigen vorgeschlagene anschließende Analysen |
|
|
Verwendung großer Mengen von komplexen Daten |
|
Neues in JMP 8:
Version 8 gibt es bislang nur für Windows. Im Frühjahr 09 (Herstellerangabe) soll es Version 8 auch für Macintosh geben.
Bei Version 8 gibt es, außer dem Introductory Guide, keine gedruckten Handbücher mehr. Diese sind aber nach wie vor als PDF auf der CD.
What is different about JMP® 8?
JMP 8 lets you interactively explore your data, instantly visualize it using powerful analytics and easily share your discoveries with others. JMP 8 comes from AS, the leader in business analytics that give organizations worldwide THE POWER TO KNOW®. So JMP also integrates beautifully with other SAS® products.
Why is JMP® 8 important?
The new interactive Graph Builder in JMP 8 enables you to build visualizations and explore data with instantaneous results. JMP 8 allows you to design and analyze choice studies to determine which product features consumers value most. Also included are more reliability analysis platforms to help you make products that last. Communicating results is easier than ever with Flash export of Bubble Plot and Profiler.
Who should use JMP® 8?
Anyone who’s curious to find out what his or her data knows. Anyone who wants to explore data and communicate discoveries to others. Anyone who understands the value of experimentation and modeling to create better products and processes. These are the people who should use JMP 8. Across any organization, statisticians and business analysts alike will uncover answers that ordinary spreadsheets with limited analytical horsepower cannot provide.
Key Features
New Platforms
• The new Graph Builder platform lets you construct graphs interactively as you explore your continuous and categorical data.
o Drag and drop to instantly create scatterplots, bar charts, histograms, trend lines, box plots and more.
o Visually compare across grouping levels for insightful analysis.
o Partition data by both continuous and categorical variables to easily see interactions.
• The new Choice platform helps you discover consumer preferences so you can tailor the features of products and services to consumer desires.
o Discover differences in market segments to create targeted offerings.
o Use what you know about consumer preferences to design your study.
o The integrated Profiler helps you understand, visualize and optimize products and services.
o Get utility scores for segmenting/clustering your data.
o Use Firth bias-corrected maximum likelihood estimators.
• New additions to the Reliability platform improve your understanding of product and part lifetimes.
o Use Fit Life by X to analyze lifetime events for accelerated test data. Compare different distributions at the same factor level or the same distribution
across different factor levels.
o Use Life Distribution to find the most suitable distributional model for your time-to-event data and make predictions. Weibull, Lognormal, Fréchet,
Extreme Value and other distributions are available.
o Use Competing Causes analysis to explore failure causes in a system and understand the effects of repair.
• Mixture Profiler shows response contours for mixture experiment models, where three or more factors in the experiment are components in a mixture.
o Visualize and optimize response surfaces resulting from mixture experiments.
Integration with SAS®
• JMP 8 works with SAS 9.1.3 and SAS 9.2.
• A new SAS toolbar provides convenient access to SAS features.
• See and import data from your local SAS server connection in the Browse SAS Data window and through JSL.
• Take stratified random samples (using PROC SURVEYSELECT) when importing data from SAS.
• Get SAS results in HTML, PDF or RTF when you submit SAS code.
• New data sets created by submitted SAS code are now tracked and imported into JMP automatically.
• Get SAS procedure output in the familiar JMP report format.
Flash Output
• Export Bubble Plots and Profilers as Adobe Flash animations for use in Web pages, presentations and other documents.
Graphs
• Use new Bubble Plot Trail Lines to connect bubble trails for enhanced visualization of change over time.
• Contour Plot now has a Color Theme menu.
• All Control Charts can now shade zones.
• Surface Plot interface has been simplified.
Design of Experiments
Design optimal Choice experiments for analysis in the Choice platform.
• Use the new design diagnostics outline node for all JMP designs.
Automatic recalculation
Auto Recalc is now available in more platforms.
Variability and gauge charts
A frequency column option is now available in the Variability launch window.
• The Variability platform has a new way to compute variance components using Bayesian estimation.
• A new bias report and graph shows the bias by each standard reference value used.
• Misclassification probabilities are now available for the Gauge R&R studies.
• Specify limits in Gauge R&R.
• Get parameter-estimates-type reports in the linearity report.
o Test both the slope and intercept.
o Test the slope to look for linearity issues.
• Make variability and standard deviation graphs vertical.
Capability analysis
• Goal plots can now draw a defect rate contour and shade Cpk regions.
• Interactively change the displayed Cpk threshold using a slider bar.
• Points appearing in goal plots now link directly to their respective columns in the original data table.
Neues in JMP 7:
JMP neue Eigenschaften | JMP Dokumentation
Delve deep into your data to understand your business inside and out. Invent, predict and improve with the utmost confidence. See for yourself all you can do with JMP 7, the latest version of statistical discovery software from SAS.
Don’t just stumble into decisions. With JMP, you can systematically explore vast amounts of data stored on your desktop, in databases or on a SAS®9 server. Other vendors claim to integrate with SAS, but only JMP – because it is a SAS product – truly delivers two-way integration.
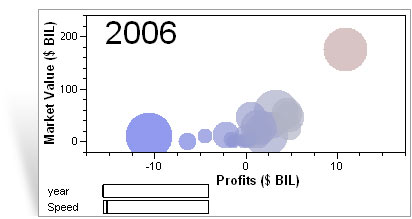
Graphics that take you beyond 3-DMost graphs limit the number of variables to three dimensions. Not JMP. New graphs routinely allow you to visualize up to seven dimensions at a time. For example, this bubble plot represents the market value and profits of several companies, colored by assets and sized by annual sales. New motion-enabled graphics show the variation in the value of any specified variable over time, business segment and company name. |
 |
|
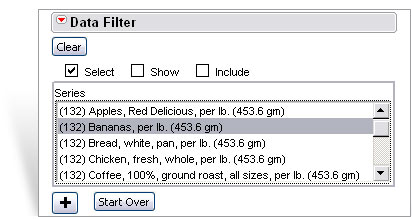
Interactive data filtering updates all graphs at oncePreviously, JMP let you capture and replay your analyses. You could even save them with your data or edit them for reuse with other data. JMP 7 goes one giant step further. Now you can select, exclude, hide or otherwise filter data, and all graphs and reports will update automatically. |
More data, faster analytics, no limits
JMP keeps pace with your data and computing demands. The software processes up to 2 billion variables and an unlimited number of records. That means JMP can handle any real-world problem. With JMP 7 on 64-bit Windows and Linux, there are virtually no restrictions on data size. And JMP 7 runs on Windows Vista™.
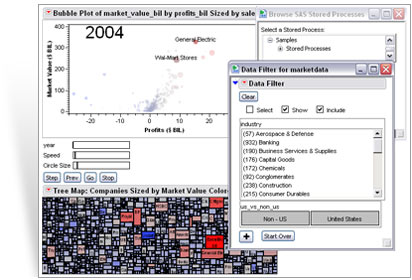
Query, visualize and interact with your SAS® data like never beforeSAS provides a rich environment for batch analytics and stored applications – plus powerful integration and manipulation tools for large amounts of data. JMP 7 adds an important dimension to SAS Analytics: dynamic business visualization. JMP is a SAS client that lets you grab, slice and spin your data to make it come alive. Everything in JMP is active. There’s no waiting for results when you submit a change, request a report or make a query to the server. With JMP, you just point, click, drag and drop to explore items of interest, and you see the results instantly. SAS programmers can write SAS code using JMP, submit it to the server, and view results as interactive JMP graphs and reports. |
 |
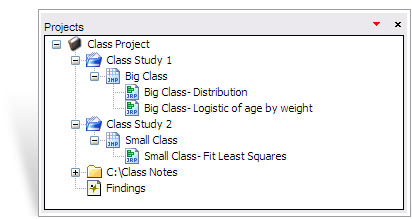 |
Share information and limit reworkAfter JMP helps you make sense of your data, it also makes it easy to share with your co-workers or managers all the project files, including data tables, journals and scripts. Just drag files and windows to the project window, and then save the project in an embedded form. When a colleague opens the project, JMP restores everything so you're ready for the next step, wherever that takes you |
 top
top
Neues in JMP 6:
JMP 6 provides significant new data management, session management, statistical coaching, statistics visualization, and split plot design of experiment capabilities. The new release also handles huge amounts of data efficiently and integrates directly with other SAS products and solutions.
JMP 6 makes analytics more accessible and usable by novice data analysts and provides experienced statisticians new advanced tools. JMP 6 efficiently handles the large quantities of data, up to 20,000 columns, encountered in corporate design, manufacturing, and financial transactional environments.
Data Management
Four new platforms are available. Value recoding, ordering, and coloring let users specify the look of a graph or plot before running an analysis, thereby creating presentation quality graphs in one step. Tabulate, JMP’s first fully drag-and-drop interface, is ideal for creating summary tables of statistics. Tree Map presents, on the tree map chart, tiles proportional to the sum or frequency of categories. Tree Map is especially useful for data that have hundreds of thousands of category levels. Missing Value Pattern, used alone or with Tree Map, identifies missing data to help you determine which data to locate or exclude from analysis.
Session Management
For the active desktop, JMP 6 window lists show all open windows grouped by their associated data table. The window list can be turned on at will and appears automatically when windows are maximized. A new Session Save feature stores the session and related data as scripts and JMP journals that can be reopened later. Saved journals can be used by any user to recreate the analysis step by step.
Statistical Coaching
New online tutorials teach JMP and interactively launch JMP against demo data. Tips of the Day are stored for lookup and can be set with user preferences to display randomly at the start of each JMP session. Menu tool tips, accessed by hovering the mouse over a menu item, describe the purpose and possible appropriate use of a menu item. Hover help is a new way to read, in a report window, an explanation of the statistic and an interpretation of any p-values.
Surface Exploration and Visualization
Response surface plots now display response surfaces for three factors. The Contour Profiler now uses transparent shading to show feasible regions, and offers improved optimization especially effective for large categorical problems. A simulator command lets users add random noise, multivariate noise with assigned correlation, and standard deviation values. Simulation results and original formulas write to a new table that includes a distribution script to show results.
Optimal Split Plot Designs
In split plots designs, a factor is constant within a block but not across blocks, thereby restricting the randomization of runs to be used when designing the experiment. Most industrial experiments are split-plot. JMP 6 is the only statistical analysis tool that accommodates split plot experiments. Users need only supply three simple design specifications – hard to change factors, the number of times you are willing to change the hard-to-change factors, and the total number of runs in your budget. Optionally, users can specify the ratio of whole plot to split plot variance. During analysis, SAS uses the Kenward and Roger adjustments to get the best possible answer automatically with a minimum of user expertise.
Solving Problems to Scale
JMP now handles up to 20,000 columns for most analyses. Large, complex plots are optimized to print quickly as bitmaps. Changes to graphs made in one place can be applied to all graphical displays related to that data. These new efficiencies mean JMP handles complex problems faster than any other desktop statistical tool.
SAS Integration
JMP integrates with SAS to marry JMP desktop data visualization, design of experiments, and exploratory data mining with the SAS production processing. JMP reads and writes SAS data sets and transport files and submits stored procedures to the SAS metabase. From its Fit Model platform, JMP 6 generates and allows direct submission of SAS code. Conversely, SAS generates JMP tables using PROC EXPORT with DBMS=JMP. This two-way transport lets users in controlled industries, such as pharmaceuticals, use SAS for data manipulation, reduction, subsetting, and statistical summarization in a secure, controlled environment, then serve data to JMP for visualization and exploratory data mining, and finally redeploy SAS for production activities.
What Are the Limitations of JMP?
JMP is a great tool for statistical exploration. So what kind of tasks would JMP not be suited for?
Very large jobs: JMP is not for problems with millions of data values. JMP data tables must fit in main memory. JMP makes graphs of everything, but graphs get expensive, more cluttered, and less useful when they have many thousands of points.
Data processing: If you need a tool for production data processing, heavy duty programming, applications development, and data management, then JMP might not be the best choice. Instead, consider using SAS software, which was designed for those types of tasks.
Specialized statistics: JMP has a wide statistical charter. With JMP, you are served with the most popular and generally useful statistical methods, but there are some specialized areas that are not currently supported in JMP.
Data tables are not spreadsheets: JMP has a spreadsheet grid to browse a data table, but the rows and columns are not arbitrary like a business spreadsheet.