|
Firma | Mathematik | Naturwissenschaft & Technik | Schule | Simulation | Programmieren | Bücher | Sonstiges | Dienstleistungen |
|||||
The cuboid correlation function1.nb |
 |
Beispiel 1 | Besipiel 2 | Besipiel 3 | Beispiel 4
By C. Herrmann & W. Gille, 1999: This is a representation of the structure functions ![]() , p(r) and A(l) of a cuboid with edges
, p(r) and A(l) of a cuboid with edges ![]() by means of a Mathematica program.
by means of a Mathematica program.
- The complete expressions for
 . Eight r-intervals are considered and simple checks are performed.
- An application of the
 expression: Determination of the chord length distribution density A(l,a,b,c) of the cuboid.
- Plots of
 , p(r,a,b,c) and A(l,a,b,c) in a special case: Fixed edges a=3, b=4, c=5 are considered.
1.Definitions of the expressions for  and simple checks.
The ![]() in the eight r-intervals are defined.
in the eight r-intervals are defined.
Display of all gama terms
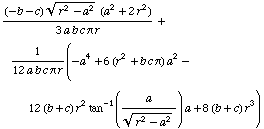
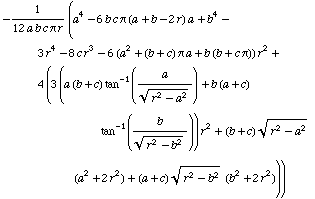
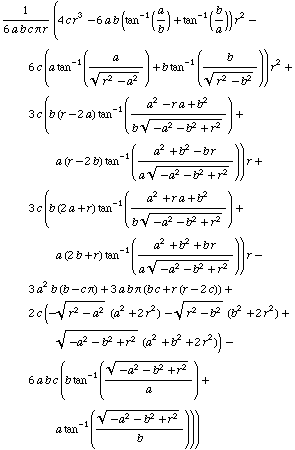
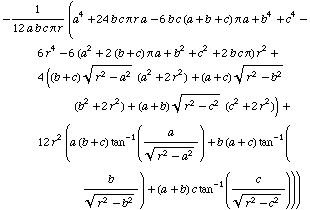
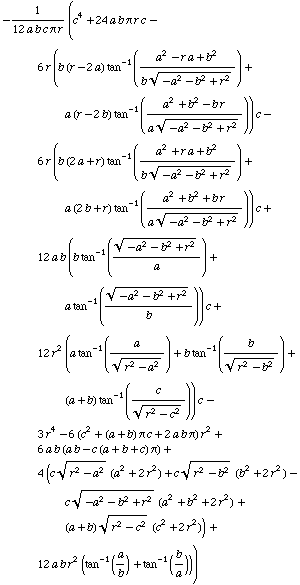
All the ![]() -terms are available in detail. Each term is restricted to a certain r-interval. Eight r-intervals are necessary. In these expressions no abbreviations are used.
-terms are available in detail. Each term is restricted to a certain r-interval. Eight r-intervals are necessary. In these expressions no abbreviations are used.
![]()
![]()
![]()
![]()
![]()
![]()
![]()
![]()

![]()

![]()
![]()
A test is performed to check the definition
The space diagonal L is the largest dimension of the cuboid. ![]() holds. Analytically this can be shown by the following lines. Here, exclusively the expression gama7 is used.
holds. Analytically this can be shown by the following lines. Here, exclusively the expression gama7 is used.
Similarly, it can be shown, that ![]() is a continuous function. All endpoints of the r-intervals, for example
is a continuous function. All endpoints of the r-intervals, for example ![]() , must be considered then.
, must be considered then.

![]()
2. Determination of the chord length distribution density A(l,a,b,c) of the cuboid

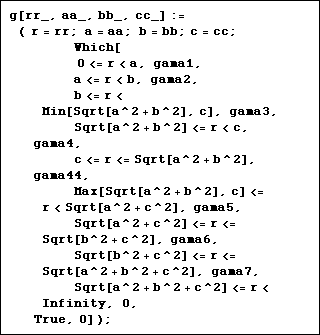
All A-terms are restricted to certain r-intervals. Based on ![]() , again, eight r-intervals are necessary.
, again, eight r-intervals are necessary.
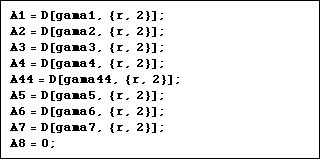
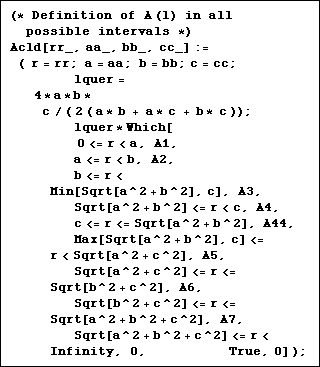
Now, the definition of A(l,a,b,c) in all possible l-intervals.
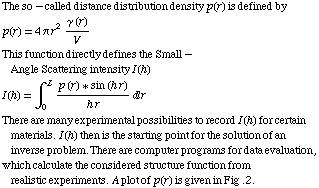
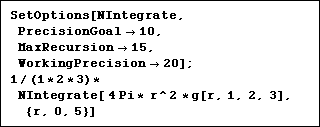
This is a test of the normalization of the chord length distribution in a case a=1, b=2, c=3. The theoretical result is 1.0

![]()
![]()
3. Plots of  , A(l,a,b,c) and p(r,a,b,c)
First, the graphical representation of a cuboid is defined.
Next, a graphical combination of cuboid , correlation function and the chord length distribution density is constructed.
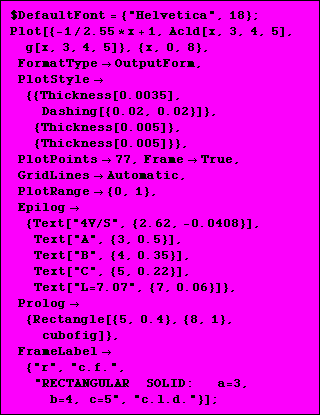
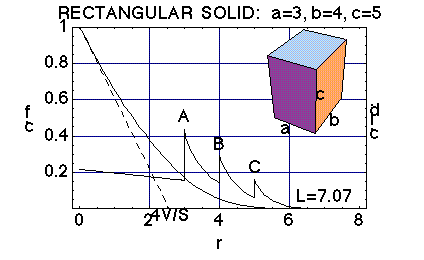
Fig. 1: The correlation function (c.f.) and the chord length distribution density (c.l.d.) of a cuboid The positions of the three spikes A, B, C in the chord length distribution clearly mark the edges a,b,c of the cuboid.
On the other hand, the maximum particle dimension ![]() cannot be detected via A(l,a,b,c).
cannot be detected via A(l,a,b,c).
The correlation function is a continuous function in the whole r-interval ![]() .
. ![]() holds, if
holds, if ![]() .
.
Finally the distance distribtion densities of cuboid and sphere are compared.
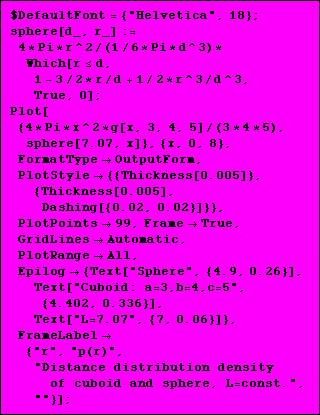
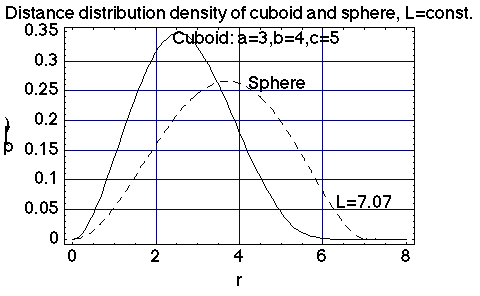
Fig. 2: The p(r) function of a cuboid and of a sphere with the same maximum dimension L The length ![]() cannot be detected exactly in such a plot.
cannot be detected exactly in such a plot.
In the case of a spherical particle, the L-estimation can be handled by differentiation of ![]() . This method does not work in the cuboid case. Here, the L-estimation is relatively complicated.
. This method does not work in the cuboid case. Here, the L-estimation is relatively complicated.
This is a consequence of the corners of this geometric figure.
